Row Properties
File Format Support (click to show)
By default, all rows in a workbook are "Visible" and have a standard height.
| Formats | Height | Hidden Rows | Outline Level |
|---|---|---|---|
| XLSX/XLSM | ✔ | ✔ | ✔ |
| XLSB | ✔ | ✔ | ✔ |
| XLML | ✔ | ✔ | ✕ |
| BIFF8 XLS | R | R | R |
| BIFF5 XLS | R | R | R |
| SYLK | ✔ | * | ✕ |
| ODS / FODS / UOS | + | + | + |
Asterisks (*) mark formats that represent hidden rows with zero height. For example, there is no way to specify a custom row height and mark that the row is hidden in the SYLK format.
Plus (+) marks formats with limited support. ODS supports specifying row heights in many units of measure. SheetJS supports some but not all ODS units.
X (✕) marks features that are not supported by the file formats. For example, the SpreadsheetML 2003 (XLML) file format does not support outline levels.
Many spreadsheet tools support adjusting row heights to accommodate multiple lines of data or varying text sizes.
Some tools additionally support row grouping or "outlining". Excel displays row outline levels to the left of the grid.
SheetJS worksheet objects store row properties in the !rows field. It is
expected to be an array of row metadata objects.
Demo
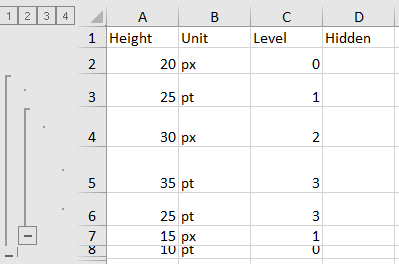
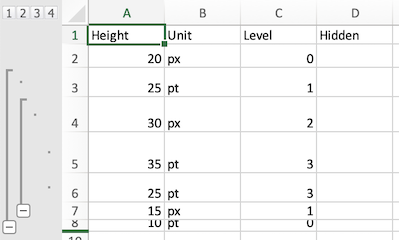
This example creates a workbook that includes custom row heights, hidden rows, and row outline levels.
| Excel for Windows | Excel for Mac |
|---|---|
|
|
Export Demo (click to show)
The table lists the assigned heights, outline levels and visibility settings.
function SheetJSRowProps() {
  const [ws, setWS] = React.useState();
  const [__html, setHTML] = React.useState("");
  const fmt = React.useRef(null);

  /* when the page is loaded, create worksheet and show table */
  React.useEffect(() => {
    /* Create worksheet from simple data */
    const data = [
      { Height: 20, Unit: "px", Level: 0 }, { Height: 25, Unit: "pt", Level: 1 },
      { Height: 30, Unit: "px", Level: 2 }, { Height: 35, Unit: "pt", Level: 3 },
      { Height: 25, Unit: "pt", Level: 3 }, { Height: 15, Unit: "px", Level: 1 },
      { Height: 10, Unit: "pt", Level: 0 }, { Hidden: true }
    ];
    const ws = XLSX.utils.json_to_sheet(data);
    /* set row metadata */
    ws["!rows"] = [];
    data.forEach((row, i) => {
      const r = {};
      if(row.Level) (ws["!rows"][i+1] = r).level = row.Level;
      if(row.Unit == "px") (ws["!rows"][i+1] = r).hpx = row.Height || 0;
      if(row.Unit == "pt") (ws["!rows"][i+1] = r).hpt = row.Height || 0;
      if(row.Hidden) (ws["!rows"][i+1] = r).hidden = true;
    });

    /* save worksheet object for the export */
    setWS(ws);
    /* generate the HTML table */
    setHTML(XLSX.utils.sheet_to_html(ws));
  }, []);

  const xport = (fmt) => {
    /* Export to file (start a download) */
    const wb = XLSX.utils.book_new();
    XLSX.utils.book_append_sheet(wb, ws, "Formats");
    XLSX.writeFile(wb, `SheetJSRowProps.${fmt}`, {cellStyles: true});
  };

  const fmts = ["xlsx", "xlsb", "xls", "slk", "ods"];
  return ( <>
    <b>File format: </b>
    <select ref={fmt}>{fmts.map(f=>(<option value={f}>{f}</option>))}</select>
    <br/><button onClick={()=>xport(fmt.current.value)}><b>Export!</b></button>
    <div dangerouslySetInnerHTML={{__html}}/>
  </> );
}
Functions
Row processing must be explicitly enabled!
Functions creating worksheet objects are not guaranteed to generate the !rows
array. Writers are not guaranteed to export row metadata.
Reading Files
read and readFile accept an options argument. The
cellStyles option must be set to true to generate row properties:
var wb = XLSX.read(data, {/* ... other options , */ cellStyles: true});
Writing Files
write and writeFile accept an options argument.
The cellStyles option must be set to true to export row properties:
XLSX.writeFile(wb, "SheetJSRowProps.xlsx", {/* ...opts , */ cellStyles: true});
Importing HTML Tables
table_to_book and table_to_sheet
process HTML DOM TABLE elements.
Individual table rows (TR elements) can be marked as hidden by setting the CSS
display property to none.
By default, hidden rows are imported and appropriately marked as hidden:
/* generate worksheet from first table, preserving hidden rows */
var tbl = document.getElementsByTagName("TABLE")[0];
var ws = XLSX.utils.table_to_sheet(tbl);
If the display option is set to true, hidden rows will be skipped:
/* generate worksheet from first table, omitting hidden rows */
var tbl = document.getElementsByTagName("TABLE")[0];
var ws = XLSX.utils.table_to_sheet(tbl, {display: true})
Exporting Data
sheet_to_csv and
sheet_to_json accept options. If the
skipHidden option is set to true, hidden rows will not be exported:
var ws = wb.Sheets[wb.SheetNames[0]]; // first worksheet
var csv = XLSX.utils.sheet_to_csv(ws, {/* ...opts, */ skipHidden: true});
Storage
The !rows property in a sheet object stores row-level metadata. If present, it
is expected to be an array of row objects.
As explained in "Addresses and Ranges", SheetJS uses
zero-indexed rows. The row metadata for Excel row 20 is stored at index 19 of
the !rows array.
When performing operations, it is strongly recommended to test for the existence of the row structure.
This snippet checks the !rows array and the specific row object, creating them
if they do not exist, before setting the hidden property of the third row:
/* Excel third row -> SheetJS row index 3 - 1 = 2 */
var ROW_INDEX = 2;

/* create !rows array if it does not exist */
if(!ws["!rows"]) ws["!rows"] = [];

/* create row metadata object if it does not exist */
if(!ws["!rows"][ROW_INDEX]) ws["!rows"][ROW_INDEX] = {hpx: 20};

/* set row to hidden */
ws["!rows"][ROW_INDEX].hidden = true;
Row Heights
Row heights can be specified in two ways:
| Property | Description |
|---|---|
hpx | Height in screen pixels |
hpt | Height in points |
The following snippet sets the height of the third row to 50 pixels:
const ROW_HEIGHT = 50;

/* Excel third row -> SheetJS row index 3 - 1 = 2 */
const ROW_INDEX = 2;

/* create !rows array if it does not exist */
if(!ws["!rows"]) ws["!rows"] = [];

/* create row metadata object if it does not exist */
if(!ws["!rows"][ROW_INDEX]) ws["!rows"][ROW_INDEX] = {hpx: ROW_HEIGHT};

/* set row height */
ws["!rows"][ROW_INDEX].hpx = ROW_HEIGHT;
Row Visibility
The hidden property controls visibility.
The following snippet hides the fourth row:
/* Excel fourth row -> SheetJS row index 4 - 1 = 3 */
var ROW_INDEX = 3;

/* create !rows array if it does not exist */
if(!ws["!rows"]) ws["!rows"] = [];

/* create row metadata object if it does not exist */
if(!ws["!rows"][ROW_INDEX]) ws["!rows"][ROW_INDEX] = {hpx: 20};

/* set row to hidden */
ws["!rows"][ROW_INDEX].hidden = true;
Outline Levels
The level property controls outline level / grouping. It is expected to be a
number between 0 and 7 inclusive.
The Excel UI displays outline levels next to the column labels. The base level
shown in the application is 1.
SheetJS is zero-indexed: the default (base) level is 0.
The following snippet sets the level of the sixth row to Excel 2 / SheetJS 1:
/* Excel level 2 -> SheetJS level 2 - 1 = 1 */
var LEVEL = 1;

/* Excel sixth row -> SheetJS row index 6 - 1 = 5 */
var ROW_INDEX = 2;

/* create !rows array if it does not exist */
if(!ws["!rows"]) ws["!rows"] = [];

/* create row metadata object if it does not exist */
if(!ws["!rows"][ROW_INDEX]) ws["!rows"][ROW_INDEX] = {hpx: 20};

/* set level */
ws["!rows"][ROW_INDEX].level = LEVEL;
Grouping Rows
Applications treat consecutive rows with the same level as part of a "group".
The "Group" command typically increments the level of each row in the range:
/* start_row and end_row are SheetJS 0-indexed row indices */
function gruppieren(ws, start_row, end_row) {
  /* create !rows array if it does not exist */
  if(!ws["!rows"]) ws["!rows"] = [];
  /* loop over every row index */
  for(var i = start_row; i <= end_row; ++i) {
    /* create row metadata object if it does not exist */
    if(!ws["!rows"][i]) ws["!rows"][i] = {hpx: 20};
    /* increment level */
    ws["!rows"][i].level = 1 + (ws["!rows"][i].level || 0);
  }
}
The "Ungroup" command typically decrements the level of each row in the range:
/* start_row and end_row are SheetJS 0-indexed row indices */
function dissocier(ws, start_row, end_row) {
  /* create !rows array if it does not exist */
  if(!ws["!rows"]) ws["!rows"] = [];
  /* loop over every row index */
  for(var i = start_row; i <= end_row; ++i) {
    /* if row metadata does not exist, the level is zero -> skip */
    if(!ws["!rows"][i]) continue;
    /* if row level is not specified, the level is zero -> skip */
    if(!ws["!rows"][i].level) continue;
    /* decrement level */
    --ws["!rows"][i].level;
  }
}
Grouping Symbol
By default, Excel displays the group collapse button on the row after the data. In the UI, this is adjusted by the option "Summary rows below detail".
SheetJS exposes this option in the above property of the "!outline" property
of worksheet objects. Setting this property to true effectively "unchecks" the
"Summary rows below detail" option in Excel:
if(!ws["outline"]) ws["!outline"] = {};
ws["!outline"].above = true; // show summary rows above detail
Implementation Details
Details (click to show)
Excel internally stores row heights in points. The default resolution is 72 DPI or 96 PPI, so the pixel and point size should agree. For different resolutions they may not agree, so the library separates the concepts.
Even though all of the information is made available, writers are expected to follow the priority order:
-
use
hpxpixel height if available -
use
hptpoint height if available