Summary Statistics
Summary statistics help people quickly understand datasets and make informed decisions. Many interesting datasets are stored in spreadsheet files.
SheetJS is a JavaScript library for reading and writing data from spreadsheets.
This demo uses SheetJS to process data in spreadsheets. We'll explore how to extract spreadsheet data and how to compute simple summary statistics. This demo will focus on two general data representations:
- "Arrays of Objects" simplifies processing by translating from the SheetJS data model to a more idiomatic data structure.
- "Dense Worksheets" directly analyzes SheetJS worksheets.
The Import Tutorial is a guided example of extracting data from a workbook. It is strongly recommended to review the tutorial first.
This browser demo was tested in the following environments:
| Browser | Date |
|---|---|
| Chromium 133 | 2025-03-30 |
| Safari 18.3 | 2025-03-30 |
| Konqueror 22 | 2025-04-23 |
Data Representations
Many worksheets include one header row followed by a number of data rows. Each row is an "observation" and each column is a "variable".
The "Array of Objects" explanations use more idiomatic JavaScript patterns. It is suitable for smaller datasets.
The "Dense Worksheets" approach is more performant, but the code patterns are reminiscent of C. The low-level approach is only encouraged when the traditional patterns are prohibitively slow.
Arrays of Objects
The idiomatic JavaScript representation of the dataset is an array of objects. Variable names are typically taken from the first row. Those names are used as keys in each observation.
| Spreadsheet | JS Data |
|---|---|
| |
The SheetJS sheet_to_json method1 can generate arrays of objects from a
worksheet object. For example, the following snippet fetches a test file and
creates an array of arrays from the first sheet:
const url = "https://docs.sheetjs.com/typedarray/iris.xlsx";

/* fetch file and pull file data into an ArrayBuffer */
const file = await (await fetch(url)).arrayBuffer();

/* parse workbook */
const workbook = XLSX.read(file, {dense: true});

/* first worksheet */
const first_sheet = workbook.Sheets[workbook.SheetNames[0]];

/* generate array of arrays */
const aoo = XLSX.utils.sheet_to_json(first_sheet);
Dense Worksheets
SheetJS "dense" worksheets2 store cells in an array of arrays. The SheetJS
read method3 accepts a special dense option to create dense worksheets.
The following example fetches a file:
/* fetch file and pull file data into an ArrayBuffer */
const url = "https://docs.sheetjs.com/typedarray/iris.xlsx";
const file = await (await fetch(url)).arrayBuffer();

/* parse workbook */
const workbook = XLSX.read(file, {dense: true});

/* first worksheet */
const first_dense_sheet = workbook.Sheets[workbook.SheetNames[0]];
The "!data" property of a dense worksheet is an array of arrays of cell
objects4. Cell objects include attributes including data type and value.
Analyzing Variables
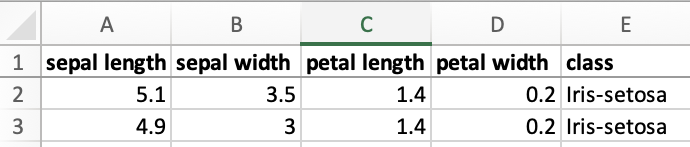
Individual variables can be extracted by looping through the array of objects and accessing specific keys. For example, using the Iris dataset:
- Array of Objects
- Dense Worksheet
The following snippet shows the first entry in the array of objects:
{
  "sepal length": 5.1,
  "sepal width": 3.5,
  "petal length": 1.4,
  "petal width": 0.2,
  "class ": "Iris-setosa"
}
The values for the sepal length variable can be extracted by indexing each
object. The following snippet prints the sepal lengths:
for(let i = 0; i < aoo.length; ++i) {
  const row = aoo[i];
  const sepal_length = row["sepal length"];
  console.log(sepal_length);
}
function SheetJSAoOExtractColumn() {
  const [col, setCol] = React.useState([]);

  React.useEffect(() => { (async() => {
    const ab = await (await fetch("/typedarray/iris.xlsx")).arrayBuffer();
    const wb = XLSX.read(ab, {dense: true});
    const aoo = XLSX.utils.sheet_to_json(wb.Sheets[wb.SheetNames[0]]);
    /* store first 5 sepal lengths in an array */
    const col = [];
    for(let i = 0; i < aoo.length; ++i) {
      const row = aoo[i];
      const sepal_length = row["sepal length"];
      col.push(sepal_length); if(col.length >= 5) break;
    }
    setCol(col);
  })(); }, []);

  return ( <>
  <b>First 5 Sepal Length Values</b><br/>
  <table><tbody><tr>{col.map(sw => (<td>{sw}</td>))}</tr></tbody></table>
  </>
  );
}
The column for the sepal length variable can be determined by testing the cell
values in the first row.
Finding the column index for the variable
The first row of cells will be the first row in the "!data" array:
const first_row = first_dense_sheet["!data"][0];
When looping over the cells in the first row, the cell must be tested in the following order:
- confirm the cell object exists (entry is not null)
- cell is a text cell (the
tproperty will be"s"5) - cell value (
vproperty6) matches"sepal length"
let C = -1;
for(let i = 0; i < first_row.length; ++i) {
  let cell = first_row[i];
  /* confirm cell exists */
  if(!cell) continue;
  /* confirm cell is a text cell */
  if(cell.t != "s") continue;
  /* compare the text */
  if(cell.v.localeCompare("sepal length") != 0) continue;
  /* save column index */
  C = i; break;
}
/* throw an error if the column cannot be found */
if(C == -1) throw new Error(`"sepal length" column cannot be found! `);
Finding the values for the variable
After finding the column index, the rest of the rows can be scanned. This time,
the cell type will be "n"7 (numeric). The following snippet prints values:
const number_of_rows = first_dense_sheet["!data"].length;
for(let R = 1; R < number_of_rows; ++R) {
  /* confirm row exists */
  let row = first_dense_sheet["!data"][R];
  if(!row) continue;
  /* confirm cell exists */
  let cell = row[C];
  if(!cell) continue;
  /* confirm cell is a numeric cell */
  if(cell.t != "n") continue;
  /* print raw value */
  console.log(cell.v);
}
Live Demo
The following snippet prints the sepal lengths:
for(let i = 0; i < aoo.length; ++i) {
  const row = aoo[i];
  const sepal_length = row["sepal length"];
  console.log(sepal_length);
}
function SheetJSDensExtractColumn() {
  const [msg, setMsg] = React.useState("");
  const [col, setCol] = React.useState([]);

  React.useEffect(() => { (async() => {
    const ab = await (await fetch("/typedarray/iris.xlsx")).arrayBuffer();
    const wb = XLSX.read(ab, {dense: true});
    /* first worksheet */
    const first_dense_sheet = wb.Sheets[wb.SheetNames[0]];

    /* find column index */
    const first_row = first_dense_sheet["!data"][0];
    let C = -1;
    for(let i = 0; i < first_row.length; ++i) {
      let cell = first_row[i];
      /* confirm cell exists */
      if(!cell) continue;
      /* confirm cell is a text cell */
      if(cell.t != "s") continue;
      /* compare the text */
      if(cell.v.localeCompare("sepal length") != 0) continue;
      /* save column index */
      C = i; break;
    }
    /* throw an error if the column cannot be found */
    if(C == -1) return setMsg(`"sepal length" column cannot be found! `);

    /* store first 5 sepal lengths in an array */
    const col = [];
    const number_of_rows = first_dense_sheet["!data"].length;
    for(let R = 1; R < number_of_rows; ++R) {
      /* confirm row exists */
      let row = first_dense_sheet["!data"][R];
      if(!row) continue;
      /* confirm cell exists */
      let cell = row[C];
      if(!cell) continue;
      /* confirm cell is a numeric cell */
      if(cell.t != "n") continue;
      /* add raw value */
      const sepal_length = cell.v;
      col.push(sepal_length); if(col.length >= 5) break;
    }

    setCol(col);
    setMsg("First 5 Sepal Length Values");
  })(); }, []);

  return ( <><b>{msg}</b><br/><table><tbody>
    {col.map(sw => (<tr><td>{sw}</td></tr>))}
  </tbody></table></> );
}
Average (Mean)
For a given sequence of numbers the mean is defined as the sum of the elements divided by the count:
In JavaScript terms, the mean of an array is the sum of the numbers in the array divided by the total number of numeric values.
Non-numeric elements and array holes do not affect the sum and do not contribute
to the count. Algorithms are expected to explicitly track the count and cannot
assume the array length property will be the correct count.
This definition aligns with the spreadsheet AVERAGE function.
AVERAGEA differs from AVERAGE in its treatment of string and Boolean values:
string values are treated as zeroes and Boolean values map to their coerced
numeric equivalent (true is 1 and false is 0).
Textbook Sum
The mean of a sequence of values can be calculated by computing the sum and dividing by the count.
- Array of Objects
- Dense Worksheet
The following function accepts an array of objects and a key.
function aoa_average_of_key(aoo, key) {
  let sum = 0, cnt = 0;
  for(let R = 0; R < aoo.length; ++R) {
    const row = aoo[R];
    if(typeof row == "undefined") continue;

    const field = row[key];
    if(typeof field != "number") continue;

    sum += field; ++cnt;
  }
  return cnt == 0 ? 0 : sum / cnt;
}
Live Demo (click to show)
function SheetJSAoOAverageKey() {
  const [avg, setAvg] = React.useState(NaN);

  function aoa_average_of_key(aoo, key) {
    let sum = 0, cnt = 0;
    for(let R = 0; R < aoo.length; ++R) {
      const row = aoo[R];
      if(typeof row == "undefined") continue;

      const field = row[key];
      if(typeof field != "number") continue;

      sum += field; ++cnt;
    }
    return cnt == 0 ? 0 : sum / cnt;
  }

  React.useEffect(() => { (async() => {
    const ab = await (await fetch("/typedarray/iris.xlsx")).arrayBuffer();
    const wb = XLSX.read(ab, {dense: true});
    const aoo = XLSX.utils.sheet_to_json(wb.Sheets[wb.SheetNames[0]]);
    setAvg(aoa_average_of_key(aoo, "sepal length"));
  })(); }, []);

  return ( <b>The average Sepal Length is {avg}</b> );
}
The following function accepts a SheetJS worksheet and a column index.
function ws_average_of_col(ws, C) {
  const data = ws["!data"];
  let sum = 0, cnt = 0;
  for(let R = 1; R < data.length; ++R) {
    const row = data[R];
    if(typeof row == "undefined") continue;

    const field = row[C];
    if(!field || field.t != "n") continue;

    sum += field.v; ++cnt;
  }
  return cnt == 0 ? 0 : sum / cnt;
}
Live Demo (click to show)
function SheetJSDenseAverageKey() {
  const [avg, setAvg] = React.useState(NaN);

  function ws_average_of_col(ws, C) {
    const data = ws["!data"];
    let sum = 0, cnt = 0;
    for(let R = 1; R < data.length; ++R) {
      const row = data[R];
      if(typeof row == "undefined") continue;

      const field = row[C];
      if(!field || field.t != "n") continue;

      sum += field.v; ++cnt;
    }
    return cnt == 0 ? 0 : sum / cnt;
  }

  React.useEffect(() => { (async() => {
    const ab = await (await fetch("/typedarray/iris.xlsx")).arrayBuffer();
    const wb = XLSX.read(ab, {dense: true});
    const ws = wb.Sheets[wb.SheetNames[0]];

    /* find column index */
    const first_row = ws["!data"][0];
    let C = -1;
    for(let i = 0; i < first_row.length; ++i) {
      let cell = first_row[i];
      /* confirm cell exists */
      if(!cell) continue;
      /* confirm cell is a text cell */
      if(cell.t != "s") continue;
      /* compare the text */
      if(cell.v.localeCompare("sepal length") != 0) continue;
      /* save column index */
      C = i; break;
    }

    setAvg(ws_average_of_col(ws, C));
  })(); }, []);

  return ( <b>The average Sepal Length is {avg}</b> );
}
The textbook method suffers from numerical issues when many values of similar magnitude are summed. As the number of elements grows, the absolute value of the sum grows to orders of magnitude larger than the absolute values of the individual values and significant figures are lost.
van Reeken
Some of the issues in the textbook approach can be addressed with a differential technique. Instead of computing the whole sum, it is possible to calculate and update an estimate for the mean.
The van Reeken array mean can be implemented in one line of JavaScript code:
for(var n = 1, mean = 0; n <= x.length; ++n) mean += (x[n-1] - mean)/n;
Math details (click to hide)
Let be the mean of the first elements (where ). The mean of the first elements follows a simple relation:
The mean of the first element is . By defining , the recurrence relation also holds for :
will serve as the initial condition for the recurrence.
JavaScript is zero-indexed: is x[0] and generally is x[m-1].
Adjusting for zero-based indexing, the following code calculates the recurrence:
/* data array */
var x = [ /* ... data ... */ ];

/* initial condition M[x;0] = 0 */
var mean = 0;

/* loop through each value in the array */
for(var m = 0; m < x.length; ++m) {
  /* store the old mean M[x;m] */
  var mean_m  = mean;
  /* get the next data point x_{m+1} */
  var x_m1    = x[m];
  /* calculate the new mean M[x;m+1] */
  var mean_m1 = mean_m + (x_m1 - mean_m) / (m + 1);
  /* update the mean */
  mean = mean_m1;
}
This can be succinctly implemented by assigning to mean directly:
for(var m = 0, mean = 0; m < x.length; ++m) {
  mean = mean + (x[m] - mean) / (m + 1);
}
This can be condensed further by using the addition assignment (+=) operator:
for(var m = 0, mean = 0; m < x.length; ++m) mean += (x[m] - mean) / (m + 1);
Replacing n = m+1 yields the final code expression:
for(var n = 1, mean = 0; n <= x.length; ++n) mean += (x[n-1] - mean) / n;
- Array of Objects
- Dense Worksheet
The following function accepts an array of objects and a key.
function aoa_mean_of_key(aoo, key) {
  let mean = 0, cnt = 0;
  for(let R = 0; R < aoo.length; ++R) {
    const row = aoo[R];
    if(typeof row == "undefined") continue;

    const field = row[key];
    if(typeof field != "number") continue;

    mean += (field - mean) / ++cnt;
  }
  return cnt == 0 ? 0 : mean;
}
Live Demo (click to show)
function SheetJSAoOMeanKey() {
  const [avg, setAvg] = React.useState(NaN);

  function aoa_mean_of_key(aoo, key) {
    let mean = 0, cnt = 0;
    for(let R = 0; R < aoo.length; ++R) {
      const row = aoo[R];
      if(typeof row == "undefined") continue;

      const field = row[key];
      if(typeof field != "number") continue;

      mean += (field - mean) / ++cnt;
    }
    return cnt == 0 ? 0 : mean;
  }

  React.useEffect(() => { (async() => {
    const ab = await (await fetch("/typedarray/iris.xlsx")).arrayBuffer();
    const wb = XLSX.read(ab, {dense: true});
    const aoo = XLSX.utils.sheet_to_json(wb.Sheets[wb.SheetNames[0]]);
    setAvg(aoa_mean_of_key(aoo, "sepal length"));
  })(); }, []);

  return ( <b>The average Sepal Length is {avg}</b> );
}
The following function accepts a SheetJS worksheet and a column index.
function ws_mean_of_col(ws, C) {
  const data = ws["!data"];
  let mean = 0, cnt = 0;
  for(let R = 1; R < data.length; ++R) {
    const row = data[R];
    if(typeof row == "undefined") continue;

    const field = row[C];
    if(!field || field.t != "n") continue;

    mean += (field.v - mean) / ++cnt;
  }
  return cnt == 0 ? 0 : mean;
}
Live Demo (click to show)
function SheetJSDenseMeanKey() {
  const [avg, setAvg] = React.useState(NaN);

  function ws_mean_of_col(ws, C) {
    const data = ws["!data"];
    let mean = 0, cnt = 0;
    for(let R = 1; R < data.length; ++R) {
      const row = data[R];
      if(typeof row == "undefined") continue;

      const field = row[C];
      if(!field || field.t != "n") continue;

      mean += (field.v - mean) / ++cnt;
    }
    return cnt == 0 ? 0 : mean;
  }

  React.useEffect(() => { (async() => {
    const ab = await (await fetch("/typedarray/iris.xlsx")).arrayBuffer();
    const wb = XLSX.read(ab, {dense: true});
    const ws = wb.Sheets[wb.SheetNames[0]];

    /* find column index */
    const first_row = ws["!data"][0];
    let C = -1;
    for(let i = 0; i < first_row.length; ++i) {
      let cell = first_row[i];
      /* confirm cell exists */
      if(!cell) continue;
      /* confirm cell is a text cell */
      if(cell.t != "s") continue;
      /* compare the text */
      if(cell.v.localeCompare("sepal length") != 0) continue;
      /* save column index */
      C = i; break;
    }

    setAvg(ws_mean_of_col(ws, C));
  })(); }, []);

  return ( <b>The average Sepal Length is {avg}</b> );
}
This algorithm is generally attributed to Welford11. However, the original paper does not propose this algorithm for calculating the mean!
Programmers including Neely12 attributed a different algorithm to Welford. van Reeken13 reported success with the algorithm presented in this section.
Knuth14 erroneously attributed this implementation of the mean to Welford.
The error in "Seminumerical Algorithms" (TAOCP Volume 2) was addressed!15
A SheetJS teammate has received a Knuth Reward Check for the contribution.
Footnotes
-
See "Note on a Method for Calculated Corrected Sums of Squares and Products" in Technometrics Vol 4 No 3 (1962 August). ↩
-
See "Comparison of Several Algorithms for Computation of Means, Standard Deviations and Correlation Coefficients" in CACM Vol 9 No 7 (1966 July). ↩
-
See "Dealing with Neely's Algorithms" in CACM Vol 11 No 3 (1968 March). ↩
-
See "The Art of Computer Programming: Seminumerical Algorithms" Third Edition page 232. ↩
-
See the "Errata for Volume 2 (after 2021)" in the TAOCP site ↩